
Master Tech skills on the go...
How to Use Google Analytics for E-Commerce Insights
Discover how to use Google analytics for E-commerce analytics: track revenue, improve conversion rates, understand customer behavior, reduce cart abandonment, and boost sales.
ONLINE INCOME & BUSINESS TOOLS
By OnlineTechSkills Editorial Team
5/14/20255 min read
Understanding your customers’ behavior, tracking sales performance, and optimizing marketing efforts are crucial for any e-commerce business. Google Analytics (GA) offers a rich suite of tools to collect, analyze, and visualize this data but unlocking its full potential requires thoughtful setup and interpretation. This guide walks you through every step from initial configuration to advanced reporting so you can turn raw data into actionable insights.
1. Getting Started: Setting Up Google Analytics for E-Commerce
1.1. Create and Configure Your GA Property
Sign up or sign in to Google Analytics at analytics.google.com.
Create a new property specifically for your online store name it clearly (e.g., “MyStore E-Commerce”).
Select the appropriate data stream (Web or Web + App) depending on whether you sell via website only or also have a mobile app.
Enable Enhanced E-Commerce under Admin » E-commerce Settings to unlock product-level data, checkout behavior tracking, and more.
1.2. Install Tracking Code
For most platforms (Shopify, WooCommerce, Magento), you can use a plugin or built-in integration simply paste your Measurement ID or Tracking ID.
If your store is custom-built, add the GA gtag.js snippet into every page’s <head>, replacing G-XXXXXX with your own ID.
Verify installation by checking Realtime » Overview—if you see yourself browsing the site, you’re all set.
2. Essential E-Commerce Metrics to Monitor
2.1. Revenue and Transactions
Revenue: Total amount generated, including tax and shipping if configured.
Transactions: Number of completed purchases.
Why it matters: These are your North Star metrics, track day-to-day fluctuations and seasonal trends.
2.2. Average Order Value (AOV)
Formula: Revenue ÷ Transactions
Tip: Experiment with upsells or free-shipping thresholds to boost AOV over time.
2.3. Conversion Rate
Formula: (Transactions ÷ Sessions) × 100
Actionable step: Run A/B tests on product pages to identify the design or copy that converts best.
2.4. Cart Abandonment Rate
Formula: [(Add-to-carts – Checkouts initiated) ÷ Add-to-carts] × 100
Quick win: Set up exit-intent popups offering a discount to recover abandoned carts.
3. Navigating GA Reports for E-Commerce
3.1. Standard E-Commerce Reports
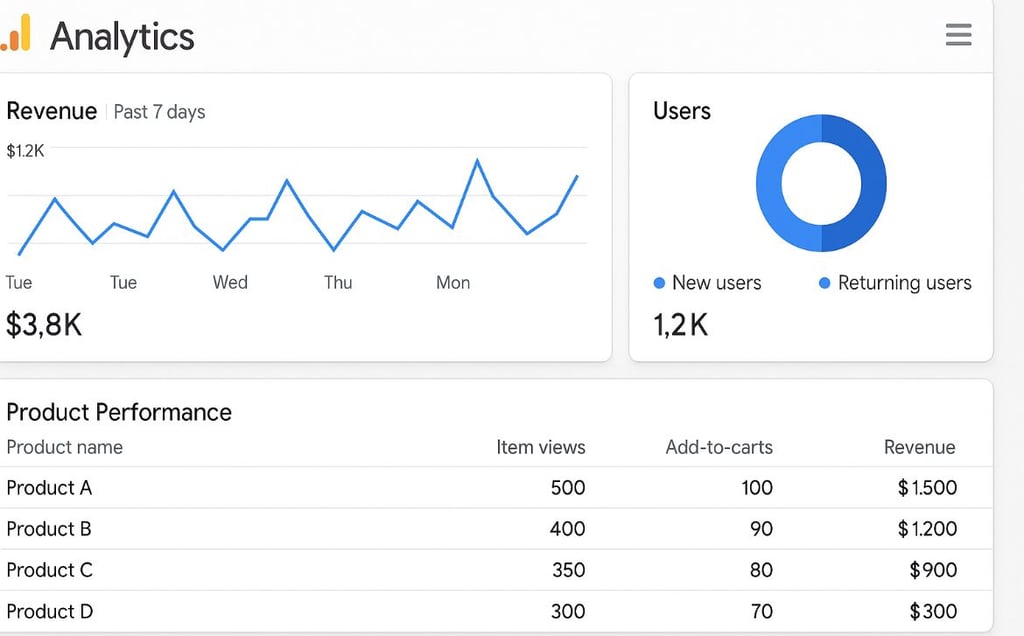
Overview: Snapshot of revenue, conversion rate, transactions, and average order value.
Product Performance: Breaks down top-selling products, quantity sold, and refund data.
Sales Performance: Timeline of revenue and transactions use date-range comparisons to monitor growth.
Shopping Behavior: Funnel visualization showing sessions → product views → add to cart → checkout → purchase.
Checkout Behavior: Identifies where customers drop off during checkout—ideal for pinpointing friction points.
3.2. Custom Reports and Explorations
For deeper dives, use Explore » Blank to build drag-and-drop funnels or Segment Overlap charts. Examples:
High-Value Customers: Segment users with lifetime value above a set threshold and analyze their channels of acquisition.
Promotion Effectiveness: Create a report filtering sessions tagged with promotion codes to see uplift in AOV.
Advanced tip: Save commonly used explorations to your library for quick access.
4. Creating Actionable Dashboards
Tailored dashboards let you see key metrics at a glance without digging through menus.
Go to Customization » Dashboards, click Create and choose Blank Canvas.
Add widgets for:
Revenue today vs. yesterday
Top 5 products by revenue
Conversion rate by traffic source
Checkout abandonment trend
Use Real-Time widgets to monitor flash sales or limited-time promotions.
For a hands-on walkthrough of building dynamic dashboards with modern frameworks, check out this guide on creating dynamic dashboards with Vue.js and Chart.js.
5. Enhanced E-Commerce: Advanced Tracking
Enhanced E-Commerce provides granular data beyond standard e-commerce:
Product Impressions and Clicks: Track how products appear in lists (e.g., category pages) and which get clicked most.
Promotion Tracking: Tag banner ads and site promotions to measure how internal marketing drives sales.
Refunds: Capture refund events to factor into net revenue calculations.
Implementation notes: You’ll need to push additional dataLayer events (e.g., ec:addImpression, ec:addProduct, ec:checkout) via JavaScript or Tag Manager. Test each event using the DebugView in GA4.
6. Segmentation and Cohort Analysis
6.1. Custom Segments
Acquisition source (e.g., organic vs. paid)
High-value vs. low-value customers
First-time vs. returning purchasers
Apply segments to any report or exploration and compare behavior, e.g., see if returning customers have a higher AOV.
6.2. Cohort Analysis
Under Explore » Cohort, define cohorts by acquisition date and measure retention or repeat purchase over subsequent weeks. Use this to gauge the stickiness of promotions or loyalty programs.
7. Attribution and Channel Performance
7.1. Default Channel Grouping
Check Acquisition » Traffic Acquisition for sessions, users, and revenues by channel (organic, paid, social, direct, referral).
7.2. Attribution Models
Under Advertising » Attribution, explore different models (last click, first click, linear) to see how credit allocation shifts across channels. This informs budget reallocation—e.g., if first-click credit shows organic search as a top contributor, double down on SEO efforts.
8. Integrations and Automations
8.1. Google Ads and Merchant Center
Link your GA property to Google Ads to import goals and audiences, enabling cross-platform remarketing and bid optimization.
8.2. BigQuery Export
For unlimited data retention and custom SQL queries, enable BigQuery Export in GA4. Analyze large datasets, join with CRM or inventory data, and build machine-learning models.
8.3. Alerts and Automated Reporting
Set up Custom Alerts to notify you when revenue dips by more than 20% in a day, or when checkout abandonment spikes. Use the GA API or third-party tools like Supermetrics to automate daily or weekly email reports.
For more on leveraging AI in your data workflows, see our post on how to use AI for data analysis and insight.
9. Case Study: From Data to Dollars
Imagine an online fashion retailer experiencing high cart abandonment:
Identify drop-off in Checkout Behavior report at the payment step.
Segment by device: mobile users show a 15% higher abandonment rate.
Hypothesize that mobile checkout UX is confusing.
Run an A/B test with a simplified single-page mobile checkout.
Result: mobile conversion rate up 25%, overall revenue up 10%.
Key takeaway: use GA data not just to observe, but to run experiments that directly impact your bottom line.
10. Best Practices and Common Pitfalls
Clean up your data: Filter out internal IP addresses and spam referrals.
Use consistent naming conventions for UTM parameters.
Document your setup in a shared spreadsheet or wiki so team members understand tracking configurations.
Don’t over-segment: too many custom dimensions can clutter reports; focus on high-impact segments.
Regular audits: quarterly reviews of tagging, events, and conversions ensure accuracy.
11. Scaling Your Analytics Program
As your store grows, consider:
Dedicated analytics resource or agency to manage GA, Tag Manager, and BI tools.
Implementing a CDP (Customer Data Platform) for unified customer profiles.
Machine-learning forecasts: use tools like Google’s Analytics Intelligence to surface anomalies or predict future revenue.
Conclusion
Google Analytics is more than just pageviews and session counts, it’s a comprehensive e-commerce intelligence platform. By properly configuring Enhanced E-Commerce, creating customized dashboards, segmenting your audience, and integrating with other tools, you can transform raw data into actionable strategies that boost revenue and improve user experience. Start small with key metrics, iterate with experiments, and scale your analytics maturity as your business expands. With these steps, you’ll gain the insights needed to make data-driven decisions and stay ahead in the competitive world of online retail.
Related articles:
Insights
Explore our free and top ranking blogs for in-demand tech skills.
CONTACT US
Support
support@onlinetechskills.com
© 2025. All rights reserved.